As the yen carry trade unwinding nuked the market now it’s time to stop your survival reptilian brain and use your analytical mammalian brain.
During uncertainty people like to seek comfort/shelter from numbers from nerds.
Today I will attempt to come up with an allocation (buy the dip) framework using Kelly’s criterion. Using the BTCUSD and SP500 as examples.
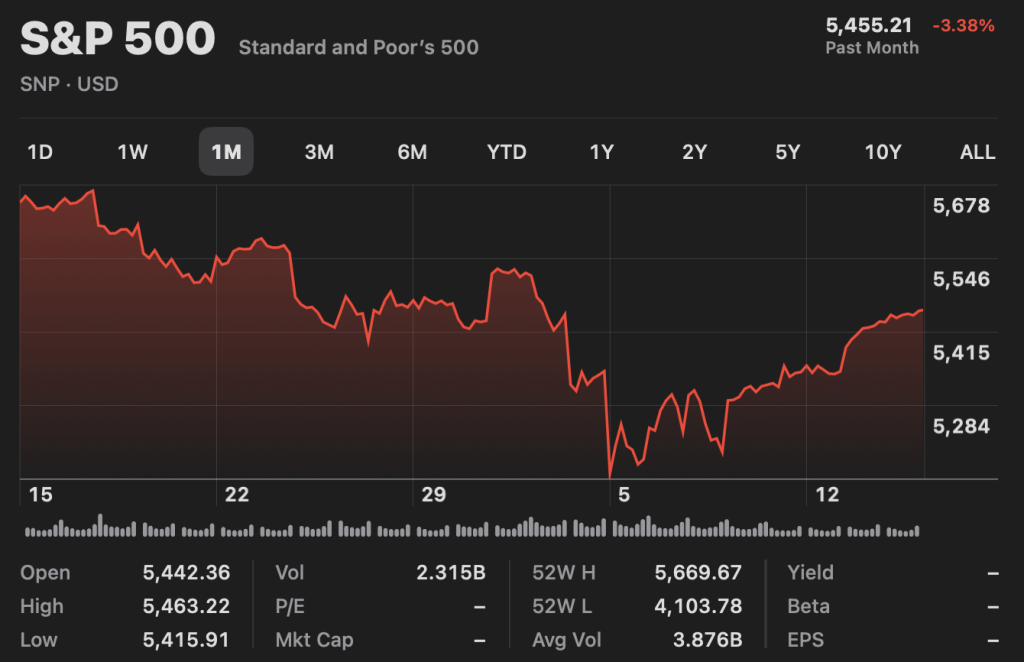
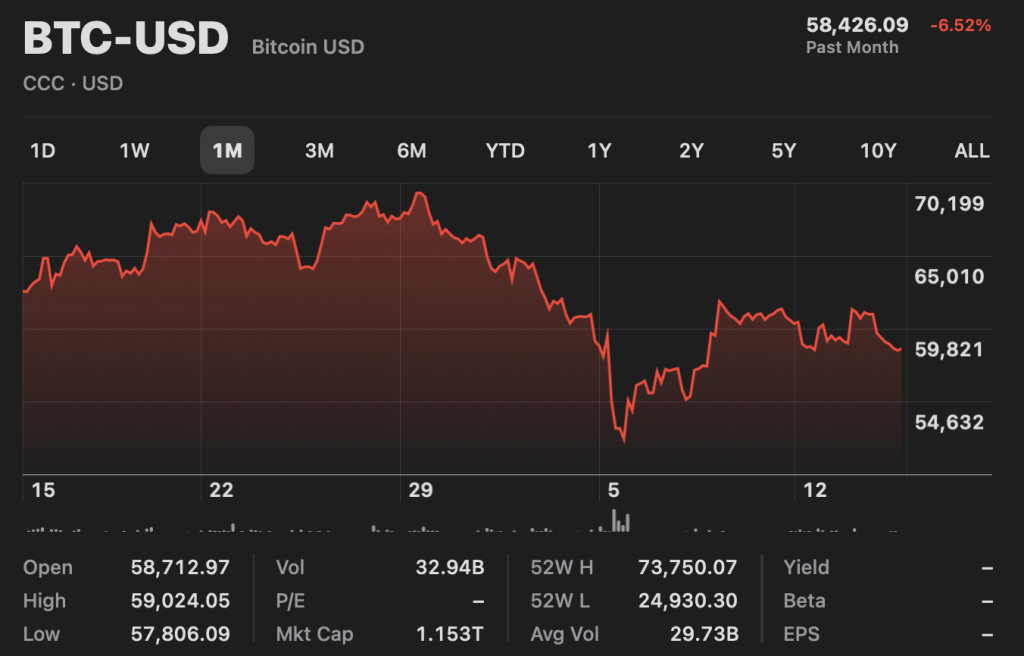
On 5th august sp500 evaporated 3% and btcusd evaporated a whopping 7%.
In the past 10 years >3% drop happened 39 times (1.55% of the time) for SP500 and >7% drop happened 103 times (2.85% of the time) for BTCUSD.
Now, given that we know the existence of volatility clustering i.e. market tend to rebound after hard drop, how should we take advantage of it?
Here’s a backtest of buying whenever SP500 dropped 3% in a day and BTCUSD dropped 7% in a day.
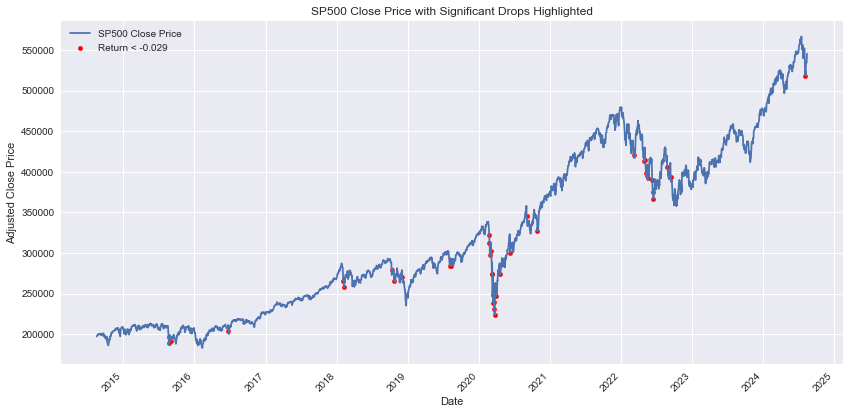
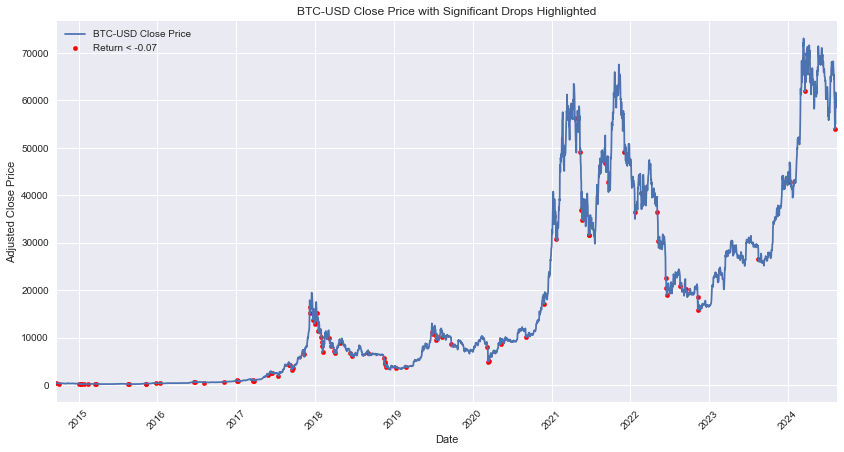
Here’s the min median max return after 1d, 1m, 6m and 1y after buying at those levels.
SP500
Statistics for 1d | Min: -2.45%, Median: 0.12%, Max: 3.43%
Statistics for 1w | Min: -5.45%, Median: 0.14%, Max: 6.07%
Statistics for 1m | Min: -2.81%, Median: 2.53%, Max: 11.32%
Statistics for 6m | Min: -6.37%, Median: 9.96%, Max: 22.16%
Statistics for 1y | Min: -0.62%, Median: 20.36%, Max: 47.62%
BTCUSD
Statistics for 1d | Min: -13.01%, Median: 0.25%, Max: 17.82%
Statistics for 1w | Min: -34.37%, Median: 0.54%, Max: 38.24%
Statistics for 1m | Min: -37.66%, Median: 2.44%, Max: 74.19%
Statistics for 6m | Min: -47.38%, Median: 5.71%, Max: 316.44%
Statistics for 1y | Min: -58.66%, Median: 20.36%, Max: 1038.45%
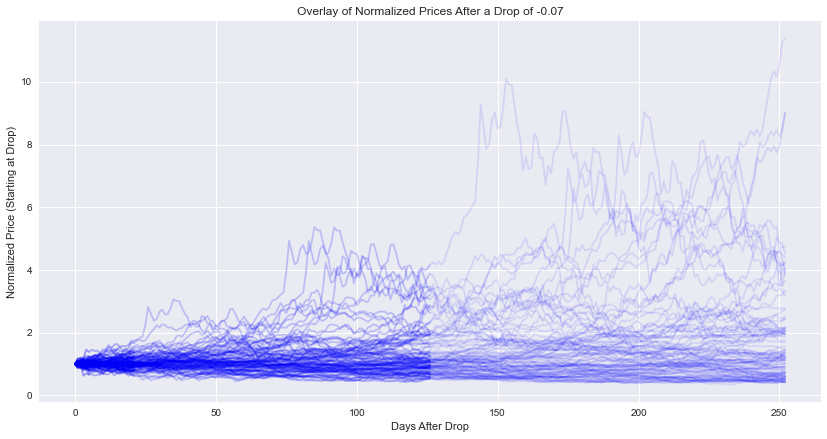
Historically if you made those bets, this is the outcome (overlaid on each other)
SP500
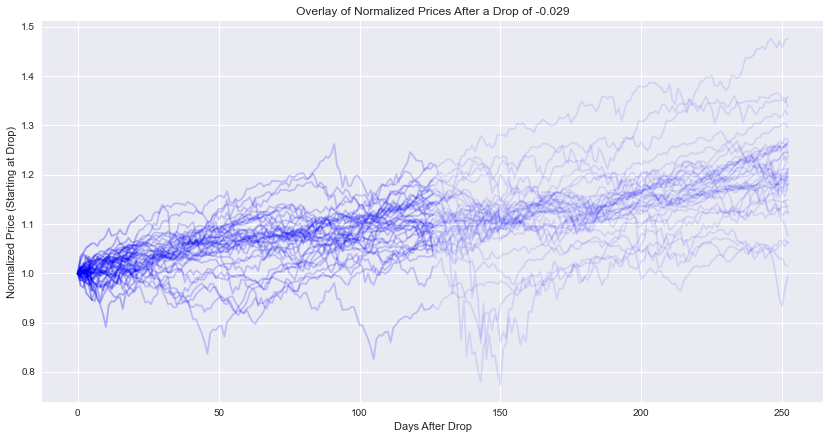
BTCUSD
using these expected outcomes, we can try to apply Kelly’s criterion on them.
The methodology calculates ensuing returns after significant price drops for different periods and converts these returns into a series for analysis. It then computes the probability of positive returns and the win/loss ratio, which are used to apply the Kelly Criterion formula to determine the optimal fraction of capital to invest. Finally, the Kelly Criterion fraction is calculated and printed for each period, guiding the capital allocation strategy based on historical return data.
SP500
Kelly Criterion fraction for 1d: 25.70%
Kelly Criterion fraction for 1w: 1.14%
Kelly Criterion fraction for 1m: 72.59%
Kelly Criterion fraction for 6m: 95.99%
Kelly Criterion fraction for 1y: 97.36%
BTCUSD
Kelly Criterion fraction for 1d: 12.48%
Kelly Criterion fraction for 1w: 6.72%
Kelly Criterion fraction for 1m: 26.39%
Kelly Criterion fraction for 6m: 40.90%
Kelly Criterion fraction for 1y: 50.45%
That’s the framework that helps to guide how much to bet, but of course things can be worse than the worst case that happened historically. So I’d more or less half the wager that is proposed by the framework, or even less (the framework suggested to put 97% which is crazy).
Now, of course using a good framework for decision making will not fix a bad investment.
The reason for SP500 and BTCUSD is just one it’s a bet that US will continue to lead the world order and BTCUSD as a hedge against excessive money printing. In my opinion market timing framework is good to have but the most important thing is the underlying has fundamental backing.
Enough yapping, TLDR is to buy the dip!
Of course, this is not an investment advice!