TradingView’s volume profile is one of the indicators that I love the most. You can
- Determine potential support and resistance levels
- How many poor souls got stuck at the peak
- What is the average entry price for most investors
But there’s a catch, it’s only available in paid version. Such powerful tools shall not be accessed to the public, but not when you know python. Here’s how to create your own volume profile indicator using python
I am using Maybank’s daily share price as example. Here’s the code snippet.
import pandas as pd
import matplotlib.pyplot as plt
plt.style.use('seaborn')

df = pd.read_csv('../../Combined/1155KL.csv')
df['Datetime'] = pd.to_datetime(df['Datetime'], format='%Y-%m-%d')
df = df[df['Datetime'] > '01-01-2021']
df = df.drop_duplicates(subset='Datetime', keep="first")

fig, ax = plt.subplots()
ax2 = ax.twiny()

ax2.plot(df['Datetime'], df['Close'], color='darkgreen')
ax.hist(df['Close'],  weights=df['Volume'],
        alpha=0.7, color='pink',
        orientation='horizontal', bins=20)
ax.grid(False)
plt.show()
Result
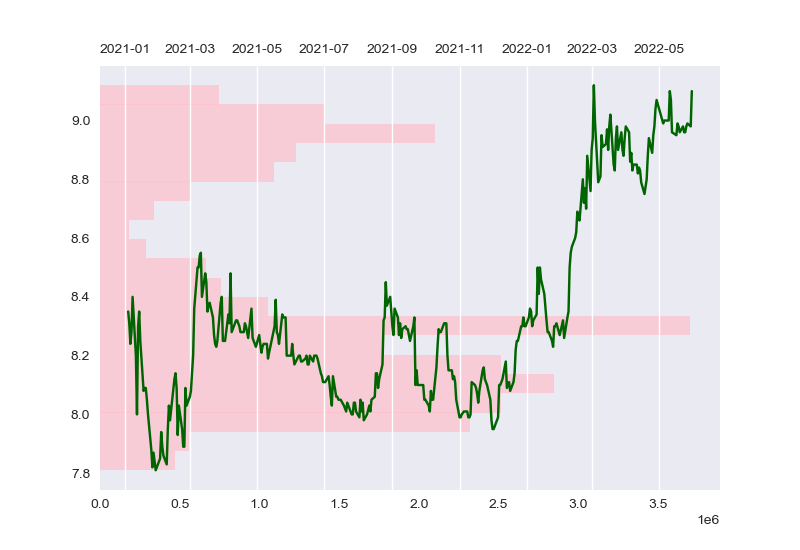
What we can observe from the volume profile chart
- from 2021, most transactions happened at RM8.40
- Hence, RM8.40 can be a potential support level as it is many investor’s entry price
- Very little investors are able to “buy the dip” successfully at RM7.80, but they are comfortable buying it at RM9.00 ?!
One thing I can’t do is that seperate the volume by buy/sell, usually these kind of dataset are very expensive. That’s all I have for you in this post, hope my content helped you ✌️