紧接着上个月的文章,俄乌战争和新冠肺炎继续陪我们到2022年4月,世界还没结束,可是市场却反弹了不少。我隐约记得港股的阿里巴巴一天内反弹30%,确切数字也不记得了,总之可以媲美大奇迹日。
上期的文章让我想了下,到底可不可能用这种信息来构造一个低买高卖的策略?
策略规则
- 每月存入 RM 1000 的现金
- 如果上个月回酬比过去2年最差10个月的任何一个月还低,买入
- 如果上个月回酬比过去2年最佳10个月的任何一个月还高,卖出 50% 的持有
- 假设交易费用为0
代码
import pandas as pd
import matplotlib.pyplot as plt
plt.style.use('seaborn')

df = pd.read_csv('data/MSP500.csv', parse_dates=['Date'])
df = df.dropna(axis = 1)

df_2years = df.head(24)
df_worst = df_2years[df_2years['Change'] < 0]
df_worst = df_worst.head(10).sort_values(by = 'Change')

df_best = df_2years[df_2years['Change'] > 0]
df_best = df_best.head(10).sort_values(by = 'Change', ascending = False)

monthly_investment = 1000
df['Cash'] = monthly_investment
df['Shares'] = 0
df['DCA'] = 0
df['Buy'] = None
df['Sell'] = None

df = df[df['Date'] > '01-01-2013']
plt.subplot(2,1,1)
plt.plot(df['Date'], df['Close'])

for i in range(0,len(df)):

    df['Shares'].iloc[i] = (df['Change'].iloc[i] + 1) * df['Shares'].iloc[i-1]
    df['DCA'].iloc[i] = (df['Change'].iloc[i] + 1) * (df['DCA'].iloc[i-1] + monthly_investment)

    df['Cash'].iloc[i] = df['Cash'].iloc[i-1] + monthly_investment
    df['Strategy'] = df['Shares'] + df['Cash']

    if (df['Change'].iloc[i]) < (df_worst['Change'].iloc[-1]) :
        df_worst = df_worst.append(df.iloc[i])
        df_worst = df_worst.sort_values(by = 'Change')
        df_worst = df_worst[:-1]

        df['Shares'].iloc[i] += df['Cash'].iloc[i]
        df['Cash'].iloc[i] = 0
        df['Buy'].iloc[i] = 1
        plt.scatter(x = df['Date'].iloc[i], y = df['Close'].iloc[i], color = 'g', marker = '^', s = 100)

    if (df['Change'].iloc[i]) > (df_best['Change'].iloc[-1]) :
        df_best = df_best.append(df.iloc[i])
        df_best = df_best.sort_values(by = 'Change', ascending = False)
        df_best = df_best[:-1]

        df['Cash'].iloc[i] += 0.5*(df['Shares'].iloc[i]*(1 + df['Change'].iloc[i]))
        df['Shares'].iloc[i] = 0.5*(df['Shares'].iloc[i]*(1 + df['Change'].iloc[i]))
        df['Sell'].iloc[i] = 1
        plt.scatter(x = df['Date'].iloc[i], y = df['Close'].iloc[i], color = 'r', marker = 'v', s = 100)

plt.subplot(2,1,2)
plt.plot(df['Date'], df['Strategy'], label = 'Strategy')
plt.plot(df['Date'], df['DCA'], label = 'DCA')

plt.legend()

plt.show()
回测结果
这次我回测的市场有4个,美国 SP500 指数, 上证指数, 新加坡新海峡指数,马来西亚KLCI指数。
有颜色的箭头分别代表,
Red Downward Arrow = SellGreen Upward Arrow = Buy
为了看到策略在什么时候买卖,所以我们就加了箭头,下方的图标是策略与定期定额投资的表现。
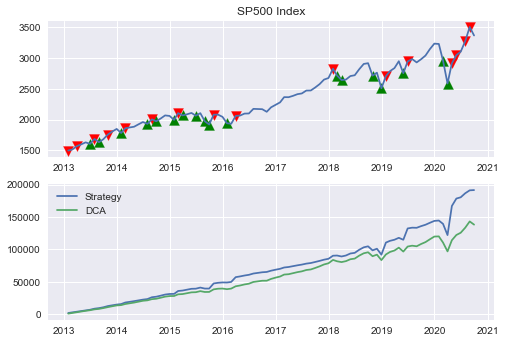
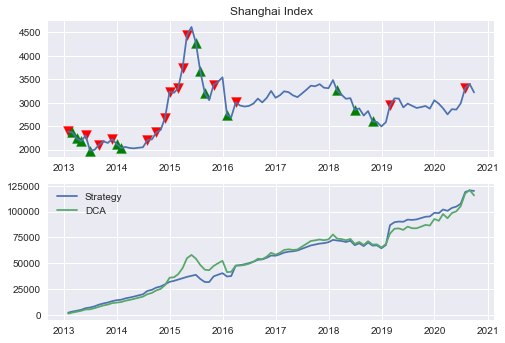
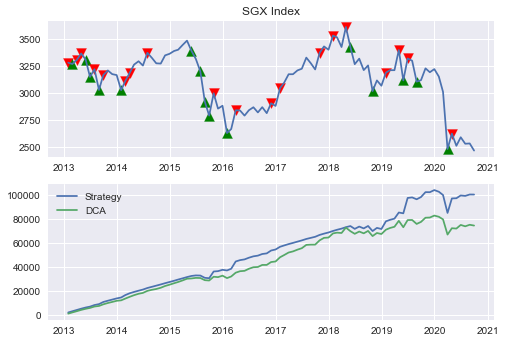
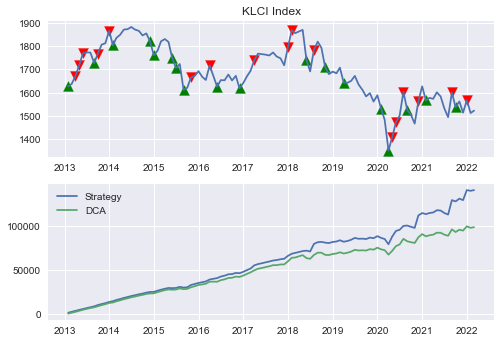
看来这低买高卖的策略是可以跑赢定期定额投资的策略,这是非常难得的,过去我回测的策略多数都难以跑赢最简单的定期定额投资策略。
结论
- 用过去最佳与最差10个月的回测当标准,低买高卖的策略是个可以跑赢定期定额的策略。
- 根据图标,此策略多次成功的“捞底”,可是当市场处于超级牛市,连续多个月破新高,此策略会过早卖出。
- 从多方面来看,这是一个理论上行得通的策略,不过对于短期牛市会有过早卖出的短处。