在TradingView里,有一个很好用的指标叫 Volume Profile Indicator 。
你可以
- 分析支撑与阻力价位
- 有多少“冤魂”住在高楼
- 其他投资者的入场价
就像天下的一切事物,好的东西得成为付费用户才可以使用,不过这个指标可以很好的做筹码分布分析。
在这里我就分享我是如何用Python来写一个自己的筹码分布分析工具。
这里就用马来西亚龙头银行Maybank来做示范。
代码
import pandas as pd
import matplotlib.pyplot as plt
plt.style.use('seaborn')

df = pd.read_csv('../../Combined/1155KL.csv')
df['Datetime'] = pd.to_datetime(df['Datetime'], format='%Y-%m-%d')
df = df[df['Datetime'] > '01-01-2021']
df = df.drop_duplicates(subset='Datetime', keep="first")

fig, ax = plt.subplots()
ax2 = ax.twiny()

ax2.plot(df['Datetime'], df['Close'], color='darkgreen')
ax.hist(df['Close'],  weights=df['Volume'],
        alpha=0.7, color='pink',
        orientation='horizontal', bins=20)
ax.grid(False)
plt.show()
分析结果
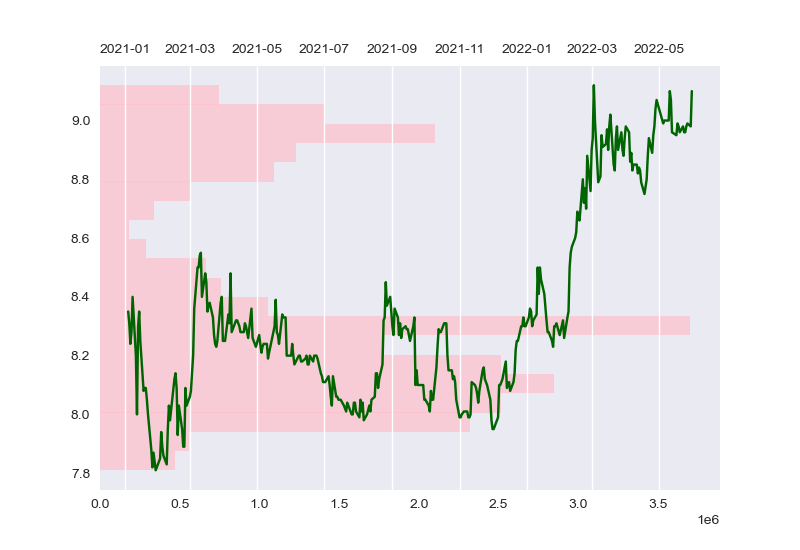
值得注意的几点,
- 从2021年到2022年,多数的交易发生在RM8.40的价位
- RM8.40 可能是一个有潜力的支撑价位
- 很少投资者在RM7.80成功捞低,不过,看来投资者们都不介意在RM9.00的高价买入,难道高价位比较安全吗?
有一点不能做到的是把交易量分成 买/卖,通常这类数据是不容易取得的。今天的分享就到这里,希望内容能够帮助到你 ✌️