Asset management industry is nothing new in Malaysia,
there are easily more than 10 asset management companies that offer mutual funds or unit trust.
As a savvy investor, I have read from a lot of places
that you are better of invest on your own.
Because markets are generally efficient,
it is hard for fund managers to consistently beat the market.
Hence many claimed that funds often do not outperform the market and it comes with hefty fees.
My background told me not to jump into conclusions so quickly,
but to analyse it with cold and hard data.
I have gathered fund performance data from a famous asset management company in Malaysia.
To avoid getting letters from lawyer let’s just call them company P.
I managed to get a fund quarterly report with data like performance, distribution and etc.
Let’s see how the data looks like in json form.
import json
import numpy as np
import matplotlib.pyplot as plt
plt.style.use('seaborn')

# Opening JSON file
f = open('data.json', )

# returns JSON object as
# a dictionary
data = json.load(f)

print(json.dumps(data['PAGF']))
{"year": [2011, 2012, 2013, 2014, 2015, 2016, 2017, 2018, 2019, 2020], "performance": [-6.76, 7.18, 15.76, -2.23, -1.62, -0.02, 12.99, -10.64, 0.99, 14.67], "benchmark": [0.78, 10.34, 10.54, -5.66, -3.9, -3, 9.45, -5.91, -6.02, 2.42], "distribution_year": [2012, 2013, 2014, 2015, 2016, 2017, 2018, 2019, 2020], "distribution": [4.5, 2.5, 2.5, 3, 2, 1.75, 1.8, 2, 1.5, 2], "distribution_yield": [7.2, 4.1, 3.7, 4.6, 3.3, 2.8, 2.8, 3.6, 3.3, 3.1]}The data is pretty self explanatory.
With fund performance and benchmark performance,
a good place to start with is to compare them.
To do this I am using boxplots to visualize it.
funds = data.keys()

performance = np.empty(1)
benchmark = np.empty(1)

try:
    for fund in funds:
        performance = np.append(performance, np.asarray(data[fund]['performance']))
        benchmark = np.append(benchmark, np.asarray(data[fund]['benchmark']))
except:
    print('error in' + fund)

f.close()

all_arr = [performance, benchmark]

plt.boxplot(all_arr)
plt.xticks([1,2], ['Fund', 'Benchmark'])
plt.axhline(y=0, color='r', linestyle='-')
plt.ylabel('Annual Return')

plt.show()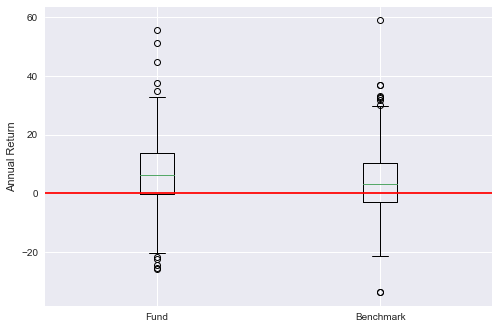
From the boxplot above we can observe that,
fund performance looks better than benchmark.
The median (line inside the box) of fund performance is obviously higher than benchmark.
Let’s look at the distribution of returns of both fund and benchmark.
num_bins = 20
plt.hist(performance, num_bins, facecolor='blue', alpha=0.2, label='fund return')
plt.hist(benchmark, num_bins, facecolor='red', alpha=0.2, label='benchmark return')

perf_mean = np.mean(performance)
benchmark_mean = np.mean(benchmark)
plt.axvline(x=perf_mean, color='blue', alpha=0.5)
plt.axvline(x=benchmark_mean, color='red', alpha=0.5)

print('Mean fund performance : %.2f' % perf_mean)
print('Mean benchmark performance : %.2f' % benchmark_mean)

plt.legend()
plt.show()
Mean fund performance : 6.49
Mean benchmark performance : 4.18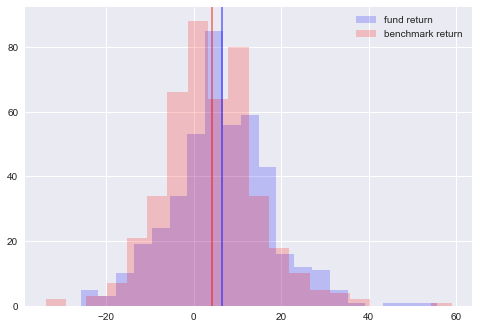
Both distribution shaped roughly the same, like normal distribution with fatter tails.
Plotting the mean of both distributions,
the mean return of fund is 6.49%
while the mean return of benchmark is 4.18%
Student’s t test
How do we know that these results are not caused by randomness?
Or in other words, are these results statistically significant?
Good for us, we can use Student’s t test to test if this is statistically significant.
We will use p = 0.05 as it is the standard used in academics.
The null hypothesis is that,
from scipy.stats import ttest_ind
stat, p = ttest_ind(performance, benchmark)
print('Statistics=%.3f, p=%.3f' % (stat, p))
# interpret
alpha = 0.05
if p > alpha:
    print('Same distributions (fail to reject H0)')
else:
    print('Different distributions (reject H0)')
Statistics=3.086, p=0.002
Different distributions (reject H0)Student’s t test is a tedious process,
luckily for us, scipy can do all the hardwork for us.
Student’s t test shows that funds do outperform the benchmark.
Thoughts
3 reasons why you SHOULD invest in unit trust
1) They do outperform the benchmark
- On aggregate, funds do outperform their benchmark by roughly 2%
- Since the returns are inclusive of fees, the returns are after fee returns which is good (excludes sales charge as sales charge is 1 time charge only)
2) Saves time & energy for investor
- Retail investor limited by knowledge and time
- With regular job and family commitments, not everyone has the time and interest to research the market
3) Liquidity
- Unit trusts are highly liquid instrument, as fund companies must purchase your units in the event of your redemption
3 reasons why you SHOULD NOT invest in unit trust
1) Yes they outperform, but by only mere low single digits
- 2% outperformance is not much, highly experienced investors can do better
2) Fees!
- Although the returns are after-fee returns, investors typically had to pay a one time fee of 1-5% sales charge during initial investment. This varies across companies.
3) Investing can be hobby for some
- Investing can be a lucrative hobby for some
- If you like to read thick financial reports, research paper, books, then you will find it fun and satisfying doing it yourself.
If you don’t, you can leave it to professionals with some fees
There is a lot of investment vehicles in the market.
Some prefer income generating assets while other prefer growth.
There is no perfect investment asset,
only the one that suits you the most
This isn’t any trading advice and the studies and analysis done were for educational and sharing purposes only