Introduction
People often equates return and risk, giving statements like “high risk high return”. If high risk does secure you high return, is the investment considered high risk anymore?
I find Howard Marks return vs risk graph a nice way to visualize risk.
According to him, the higher the risk, the more variability your return becomes.
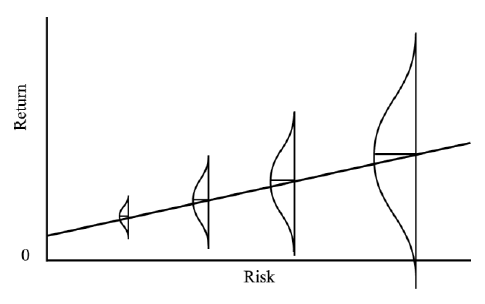
Different asset classes have their inherent risk.
Equity asset often relates to people as higher risk, because sometimes it delivers higher return and sometimes lower return compared to other asset classes, with ranges in (-20 to 50% We are talking about overall equity market here).
A lot of factors can play with an equity’s risk, market condition, company earnings, new competitor and etc.
Bond asset is often considered as low risk asset, because of the return of the asset is fixed (sometimes also called fixed income asset), it has lesser variability in their returns (3 to 8%).
Bond on the other hand, the main risk is the company going bankrupt, defaulting on the bond you are holding.
John Bogle’s strategy
John Bogle the founder of The Vanguard Group, an american fund management giant.
His investment strategy is to allocate equity/bond with ratio of 50/50. Every year, you will need to rebalance your portfolio.
For example
| Stock | Bond |
|---|---|
| 5500 | 5100 |
you will need to take 400 from equity asset to bond asset, make the ratio 50/50 again.
The rationale behind this is to “balance” the portfolio, a higher equity price might mean overvalued equity, hence reducing your position on overvalued asset.
Vice versa, when the equity price is low, you shift money from bond to equity, to buy more of the undervalued asset.
How about Modern Portfolio Theory?
The Nobel prize winner Markowitz doesn’t even use the strategy himself,
“I visualized my grief if the stock market went way up and I wasn’t in it — or if it went way down and I was completely in it. So I split my contributions 50/50 between stocks and bonds.”
https://www.mymoneyblog.com/harry-markowitz-personal-investment-portfolio.html
So it seems like Markowitz himself is using a 50/50 portfolio instead of the Modern Portfolio Theory that won him a Nobel Prize.
Methodology
The data I am using are funds from a local unit trust giant company P.
The equity funds I used are Global Equity Fund, East-Asia Equity Fund, Malaysia Index Fund. They well represent the whole equity market as a whole.
The bond fund I used are Enhanced Bond Fund.
The data used are from 2006 to 2020, to visualize the long term returns.
I am using Python for the calculation (because it is vastly easier than MS Excel), if you are interested please drop me an email.
Loading the Dataset
We need pandas for data processing, seaborn and matplotlib are for data visualization purpose.
import pandas as pd
import seaborn as sns
import matplotlib.pyplot as plt

#read portfolio data
Return = pd.DataFrame()
p = pd.read_csv('Portfolio.csv', parse_dates=['Date'])
Return['Date'] = p['Date']
Return['Date'] = pd.DatetimeIndex(Return['Date']).year.astype(float)
print(p.head)
Analysis
Some calculation logic
def CalculateReturn(Equity,Bond,Investment):
# Equity
PGSF = 0.15
PIX = 0.15
PFES = 0.7
# Bond
PBOND = 1.0
portfolio = pd.read_csv('Portfolio.csv', parse_dates=['Date'])
EquityInvestment = Equity*Investment
BondInvestment = Bond*Investment
portfolio['PGSF Value'] = ""
portfolio['PIX Value'] = ""
portfolio['PFES Value'] = ""
portfolio['PBOND Value'] = ""
portfolio['Rebalanced E'] = ""
portfolio['Rebalanced B'] = ""
#first year value
portfolio['PGSF Value'][0] = EquityInvestment * PGSF * portfolio['PGSF'][0]
portfolio['PIX Value'][0] = EquityInvestment * PIX * portfolio['PIX'][0]
portfolio['PFES Value'][0] = EquityInvestment * PFES * portfolio['PFES'][0]
portfolio['PBOND Value'][0] = BondInvestment * PBOND * portfolio['PBOND'][0]
portfolio['Rebalanced E'][0] = portfolio['PGSF Value'][0] + portfolio['PIX Value'][0] + portfolio['PFES Value'][0]
portfolio['Rebalanced B'][0] = portfolio['PBOND Value'][0]
for i in range(1,15):
portfolio['PGSF Value'][i] = portfolio['Rebalanced E'][i-1] * PGSF * portfolio['PGSF'][i]
portfolio['PIX Value'][i] = portfolio['Rebalanced E'][i-1] * PIX * portfolio['PIX'][i]
portfolio['PFES Value'][i] = portfolio['Rebalanced E'][i-1] * PFES * portfolio['PFES'][i]
portfolio['PBOND Value'][i] = portfolio['Rebalanced B'][i-1] * PBOND * portfolio['PBOND'][i]
totalVal = portfolio['PGSF Value'][i] + portfolio['PIX Value'][i] + portfolio['PFES Value'][i] + portfolio['PBOND Value'][i]
portfolio['Rebalanced E'][i] = totalVal * Equity
portfolio['Rebalanced B'][i] = totalVal * Bond
portfolio['Total'] = portfolio['Rebalanced B'] + portfolio['Rebalanced E']
return portfolio['Total']
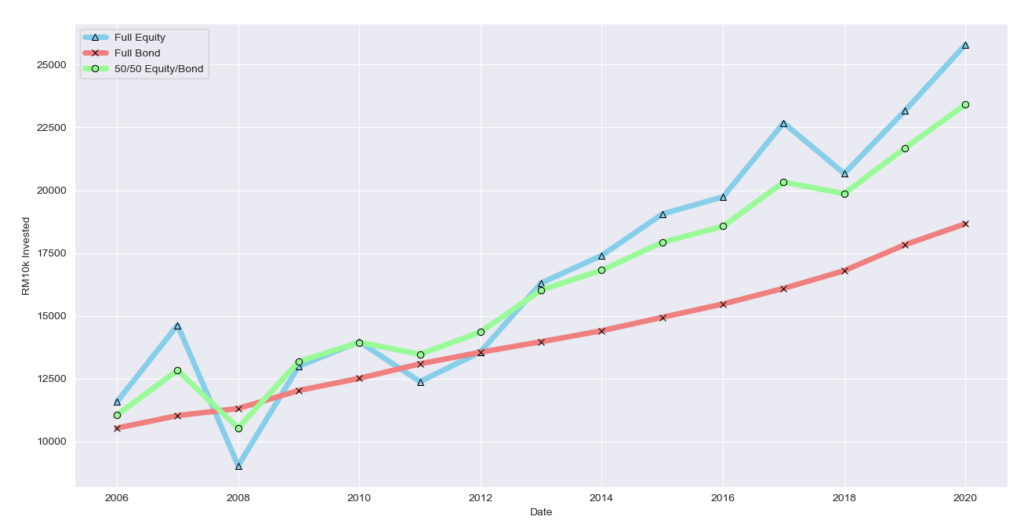
Return['Equity'] = CalculateReturn(1,0,20000).astype(float)
Return['Bond'] = CalculateReturn(0,1,20000).astype(float)
Return['50/50 Equity/Bond'] = CalculateReturn(0.5,0.5,20000).astype(float)
print(Return)Output
Visualize the output
sns.set_style("darkgrid")
p = sns.color_palette("hls", 8)

ax = sns.lineplot(data=Return,y='Equity',x='Date',label="Full Equity", color='skyblue', marker='^',markeredgecolor="black",linewidth=5)
ax = sns.lineplot(data=Return,y='Bond',x='Date',label="Full Bond",color='lightcoral',marker="x",markeredgecolor="black",linewidth=5)
ax = sns.lineplot(data=Return,y='50/50 Equity/Bond',x='Date',color='palegreen',label="50/50 Equity/Bond",marker="o",markeredgecolor="black",linewidth=5)

ax.set(xlabel="Date",ylabel="RM10k Invested")
plt.legend()
plt.show()
Results
| Full Equity | Full Bond | 50/50 Equity | |
|---|---|---|---|
| Return | 270% | 105% | 244% |
| Asset Value in 2020 | 27142 | 18664 | 24482 |
| Lowest point | 9971 | 10532 | 11191 |
Some might point out that volatility isn’t a bad thing, but I think we can agree that volatility is not for the fainted heart.
No all of us can sleep well when our portfolio is down 20%, with a nice spiced combo, we can sleep well while not sacrificing a big chunk of your return.
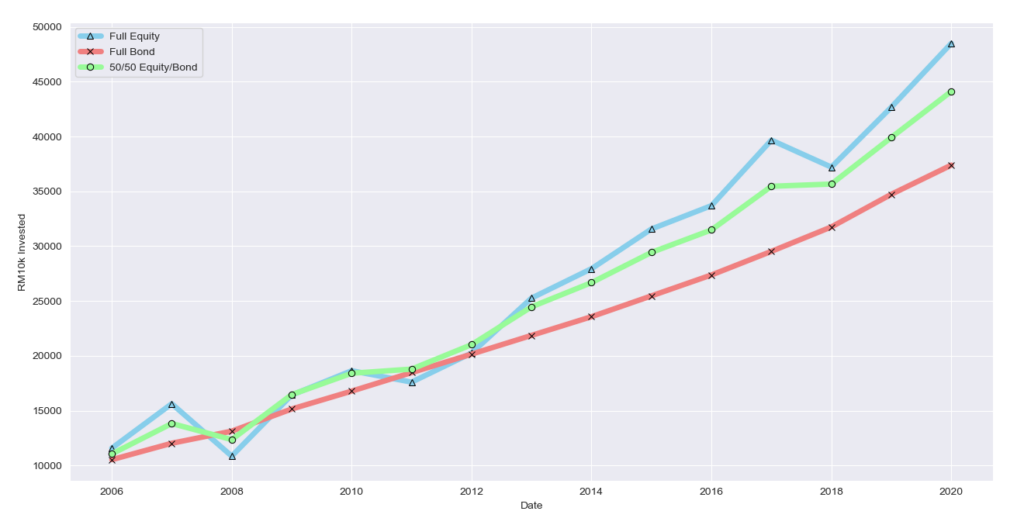
What if you added more money every year?
What if we added RM1000 every year (A rather small amount)?
As expected, the portfolio will grow a lot faster.
Key Takeaways
- Nice risk/reward ratio. Reduced volatility while preserving returns.
- Diversification don’t necessary take away a lot of your return. The 50/50 combo is only a 10% (RM2600 difference) worse than full equity combo, with lesser volatility.
- We cannot rebalance our portfolio too often because it might incur charges.