马来西亚可以看到大大小小的资产管理公司
单单是信托基金公司都有10多家了
所以信托基金在马来西亚算是非常普遍的
从很多书籍可以读到
投资是可以DIY的
市场很多时候是有效的 (efficient market hypothesis)
因此基金经理不容易持续性的跑赢大市
还有大大小小的费用
拥有技术背景的小编自然不会那么快下定论
信托基金到底赚不赚钱还是要看数据来下定论
小编从网络上搜集的著名信托基金P公司旗下基金的数据
整理数据后数据是用json格式来储存
先来看看数据到底张怎么样
import json
import numpy as np
import matplotlib.pyplot as plt
plt.style.use('seaborn')

f = open('data.json', )
data = json.load(f)

print(json.dumps(data['PAGF']))
{"year": [2011, 2012, 2013, 2014, 2015, 2016, 2017, 2018, 2019, 2020], "performance": [-6.76, 7.18, 15.76, -2.23, -1.62, -0.02, 12.99, -10.64, 0.99, 14.67], "benchmark": [0.78, 10.34, 10.54, -5.66, -3.9, -3, 9.45, -5.91, -6.02, 2.42], "distribution_year": [2012, 2013, 2014, 2015, 2016, 2017, 2018, 2019, 2020], "distribution": [4.5, 2.5, 2.5, 3, 2, 1.75, 1.8, 2, 1.5, 2], "distribution_yield": [7.2, 4.1, 3.7, 4.6, 3.3, 2.8, 2.8, 3.6, 3.3, 3.1]}‘year’ 一栏是基金的年份
‘performance’ 一栏是指基金的表现
‘benchmark’ 一栏是指大市的表现
‘distribution_year’ 一栏是基金派息的年份
‘distribution’ 一栏是基金派息的数额
‘distribution_yield’ 一栏是基金派息的巴仙率
现在比较看看基金与大市的表现看看如何
funds = data.keys()

performance = np.empty(1)
benchmark = np.empty(1)

for fund in funds:
    performance = np.append(performance, np.asarray(data[fund]['performance']))
    benchmark = np.append(benchmark, np.asarray(data[fund]['benchmark']))

f.close()

all_arr = [performance, benchmark]

plt.boxplot(all_arr)
plt.xticks([1,2], ['Fund', 'Benchmark'])
plt.axhline(y=0, color='r', linestyle='-')
plt.ylabel('Annual Return')

plt.show()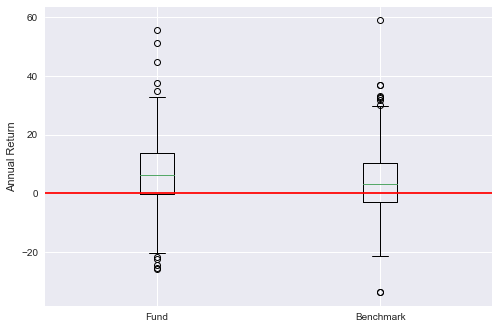
从以上的boxplot我们可以看到
基金的表现看起来是比大市好
格子里中间的线是代表中位数,基金的中位数表现明显比大市好
现在来看看回酬的分布
num_bins = 20
plt.hist(performance, num_bins, facecolor='blue', alpha=0.2, label='fund return')
plt.hist(benchmark, num_bins, facecolor='red', alpha=0.2, label='benchmark return')

perf_mean = np.mean(performance)
benchmark_mean = np.mean(benchmark)
plt.axvline(x=perf_mean, color='blue', alpha=0.5)
plt.axvline(x=benchmark_mean, color='red', alpha=0.5)

print('Mean fund performance : %.2f' % perf_mean)
print('Mean benchmark performance : %.2f' % benchmark_mean)

plt.legend()
plt.show()
Mean fund performance : 6.49
Mean benchmark performance : 4.18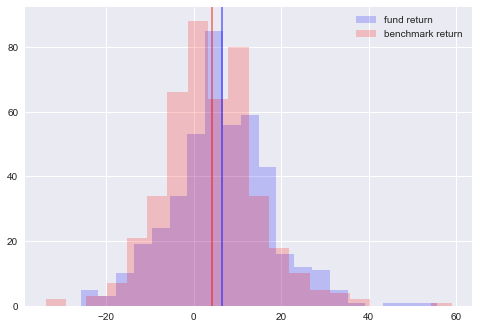
基金与大市的分布看起来差不多
不同的是基金的平均年回酬为6.49%
大市平均年回酬为 4.18%
t 检验 (Student’s t test)
我们要如何知道这些结果不是因为随机性导致的呢?
这些结果到底在统计学上有没有意义?
要知道这点我们可以用t检验来测试
幸运的是 scipy 模块已经有了t建议的函数
不必自己写
这里就不解释什么是t检验了,有兴趣的读者可以自行研究
小编用的是学术界里常用的 p = 0.05 来做阈值
null hypothesis为
基金并没有跑赢大市
如果 p值 小于0.05
我们可以reject null hypothesis并接受alternative hypothesis
就是 基金的确跑赢大市
from scipy.stats import ttest_ind
stat, p = ttest_ind(performance, benchmark)
print('Statistics=%.3f, p=%.3f' % (stat, p))
# interpret
alpha = 0.05
if p > alpha:
    print('Same distributions (fail to reject H0)')
else:
    print('Different distributions (reject H0)')
Statistics=3.086, p=0.002
Different distributions (reject H0)t检验的p值为0.002,小于阈值0.05,
t检验的结论为
基金的确跑赢大市
结论
投资信托基金的3大原因
1) 基金的确跑赢大市
- 整体上,基金跑赢大市大概2%左右
- 这些数据是已经包括年费,扣除年费基金还能跑赢大市的话是非常不错了 (没包括sales charge)
2) 为投资者节省时间精力
- 散户投资者的时间与知识有限
- 工作和家庭责任已经占据大部分人的时间,投资功课需要花时间去研究,所以并不适合所有人
3) 流动性
- 不像储蓄保险,没有资金锁定
- 高流动性,容易套现。当你想卖出基金时,基金公司必须向你买回
不投资信托基金的3大原因
1) 虽然跑赢大市,可是跑赢不多
- 虽说基金可以跑赢大市,可是幅度并不多,只有大概2%。有经验的投资者是可以达到更好的回酬
2) 手续费
- 投资基金会有一个一次性的sales charge。不同的公司有不同的费用,通常介于1-5%之前。因为是一次性所以不包含在数据中
3) 投资可以是爱好
- 如果你的兴趣是阅读厚厚的财务报告,行业分析,经济与政治分析等,自己做投资是不错的选择
- 其实投资做的功课不只是看PE ROE,还要分析生意描述,竞争分析等
市场上有很多种不同的投资工具
没有最好的投资工具
只有最适合你的投资工具
纯属分享,无买卖建议