Warren Buffett says…
Diversification is for Idiots
I have seen a lot of gurus and market experts advocating
you should focus your ammunition on 2-3 stocks that you know really well.
They claim that retail investors don’t have the capability to own so much stocks and limited time to do research on companies.
Even Malaysian stock “influencers” also advocate the same.
Of course I’m not going to name them.
This statement is true considering many retail investors have limited financial knowledge,
even if they think they have, they only scratched the surface of it.
What is Risk Anyway?
The “academic” way of measuring risk is the standard deviation of price.
A good example is the usage of standard deviation as risk in Sharpe ratio and Markowitz Modern Portfolio Theory.
There are also another school of thoughts thinking that measuring risk using standard deviation is not sufficient.
These camps include Howard Marks and Nassim Taleb.
Their idea is that risk is the risk of ruin. Risk of blowing up your portfolio.
Which is difficult to quantify.
I think that both camps have their strong point. But I have no idea how to measure the risk of blowing up
(Monte Carlo method perhaps?) I will stick to the academic way of measuring risk.
How Diversification Works?
There is a simple way of thinking about this.
Let us compare two portfolios.
Portfolio A (2-3 stocks)
Portfolio B (20-30 stocks)
Which portfolio has greater chance of blowing up?
The obvious answer is Portfolio A (Provided is diversified well)
For portfolio B to go completely ruin, 20-30 stocks have to go wrong all at once.
By diversifying, you eliminate specific risk of individual company/industry.
But you will be still expose to overall market risk that you cannot control.
Why Care If My Returns are Good?
Some might argue that,
why should I care if my performance is doing 20% annually?
On absolute terms it looked really good.
In the investment world, there is a performance metric that not many retail investors are aware,
which is Sharpe ratio.
Sharpe ratio is a measure of how much return you are getting per unit of risk.
Are you making 20% with 50% price volatility?
Are you making 10% with 5% price volatility?
High Sharpe ratio is better as you are getting more from same unit of risk taken.
After all to make extremely high returns you can always take on more risk by leveraging.
The point is how much you are making per unit of risk taken.
Talk is Cheap, Show Me the Code
import pandas as pd
import numpy as np
import matplotlib.pyplot as plt

stock_data = pd.read_csv('A.csv',parse_dates=['Datetime'])
stock_data['Changes_Next_Year'] = stock_data.groupby('Code')['Change'].shift(-1)
stock_data.dropna(subset=['Changes_Next_Year'],inplace=False)

def simulate(stock_data, NumberOfShares):
    '''
    Randomly select n number of shares
    and check their annual performance
    '''
    stock_data = stock_data.groupby(['Datetime']).sample(NumberOfShares)
    output = pd.DataFrame()
    stock_data['Code'] += ' '
    stock_data_groupby = stock_data.groupby('Datetime')
    output['Shares_bought'] = stock_data_groupby['Code'].sum()
    output['Number of shares'] = stock_data_groupby.size()
    output['Average gains'] = stock_data_groupby['Changes_Next_Year'].mean()
    output['Average gains'].replace(np.inf, 0, inplace=True)

    output['Capital'] = 0
    output = output.dropna()

    output['Capital'] = (output['Average gains']+1.0).cumprod()
    output['Average gains'] = output['Average gains']*100.0

    return output['Average gains'].mean(), output['Average gains'].std()
This returns the average annual return and the standard deviation of average annual return.
Below is an example.
print(simulate(stock_data, 2))(-0.8091180509071682, 30.902721358344397)Now we have got the simulate function,
we just have to run it multiple times, and try different number of stocks in portfolio,
and visualize the data.
def run(stock_data,NumberOfShares):
    ret = 0
    std = 0

    iteration = 60
    for i in range(1,iteration + 1):
        r,s = simulate(stock_data,NumberOfShares)
        ret += r
        std += s

    return ret/(iteration), std/(iteration)

# simulate from 1 stock to 100 stocks portfolio
stdev = []
ret = []
for i in range(1,100):
    tempr, temps = run(stock_data,i)
    stdev.append(temps)
    ret.append(tempr)

# visualize the data
fig, ax1 = plt.subplots(figsize=(10,5))
plt.style.use('seaborn')

ax2 = ax1.twinx()
ax1.plot(stdev, 'darkgreen',linestyle = '-', marker = '.', alpha = 0.5)
ax2.plot(ret, 'darkblue', linestyle = '-', marker = '.', alpha = 0.5)

ax1.set_xlabel('Number of Shares in portfolio')
ax1.set_ylabel('Standard Deviation of Returns', color='darkgreen')
ax2.set_ylabel('Average Compounded Annual Growth Rate', color='darkblue')
ax1.grid(False)
ax2.grid(False)

plt.show()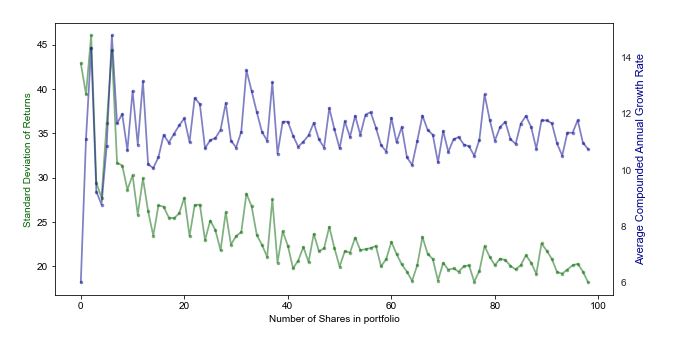
Key Takeaways
- Having more stocks in your portfolio can reduce your volatility in returns (Risk).
- Interestingly, having more stocks in your portfolio can also stabilize your returns, giving you better expectation of what returns you will have.
- The shares in portfolio are selected randomly , in practice we should diversify by selecting uncorrelated shares in portfolio.
For example, you don’t need another tech stocks if you are already holding FAANG. - Up to a certain number of shares (10-15), the risk is stabilized.
The risk is about the same if holding 20 stocks vs holding 40 stocks. - It might not be practical for retail investor to research on 10-15 companies and the same time.
Given the knowledge and time retail investors have, studying that number of stocks are impractical.
Furthermore, retail investors cannot guarantee that the research they did is unbiased and accurate. - Practical solution is to hold funds(unit trust, mutual fund, government fund) or ETFs, these funds are usually very diversified on different assets, fixed income, equities and etc.
However it is not for the adventurous.
Diversification is for idiots. But it’s safer to assume that you are an idiot.