Whether it’s PE, ROE, DY there are tons of financial jargon and financial ratios out there. The value investors emphasize on buying cheap (low PE, PB), while growth investors focus on buying stocks with high growth (high ROE etc). How do we know which ratio is the most useful to find out potentially profitable stocks? Let’s find out.
Introduction
For today’s topic, I am going to introduce a backtesting tool that I have developed myself during free time. https://www.klsequant.com
So what’s the main goal/function of this web app? Say that you have a stock picking strategy that you wanted to test out. For example, buy a stock when PE is below 10 while ROE is above 20. Then you can backtest your strategy, to see how well your stock picking strategy has performed over the last 10 years (The dataset is from 2010 to 2019).
This is a web app based on Python Flask framework and this is a new challenge for me because I have only coded in Python but never in web environment. I coded the app and hosted in on pythonanywhere, definitely check them out if you are a Python guy.
Brief Explanation of the User Interface
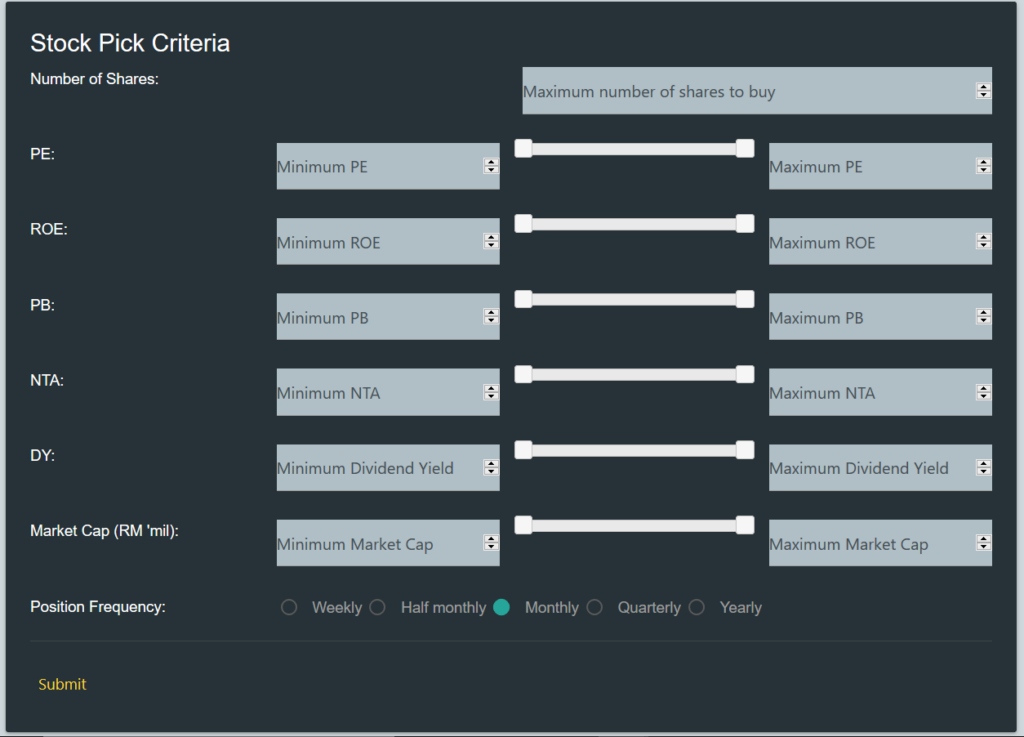
Let me have a basic introduction to the user interface. There is 14 inputs for you, the maximum number of shares field however must be filled, the other fields are fill solely based on your stock pick criteria.
Usage Demonstration
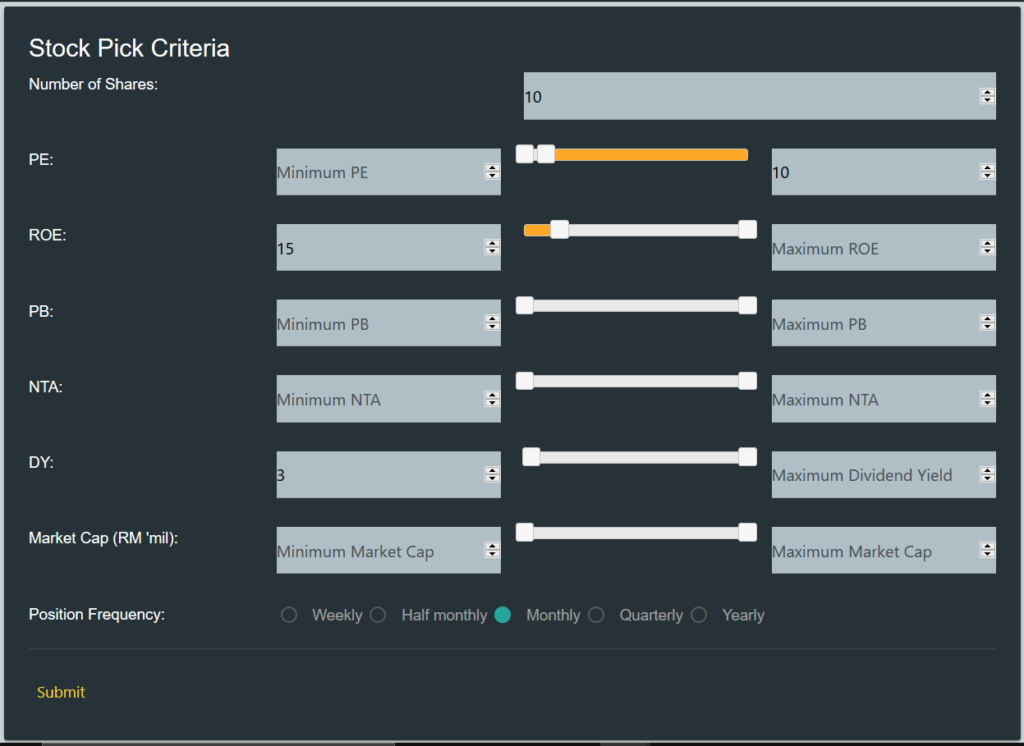
For demonstration purpose, the strategy I am using are buy when (Maximum number of stocks to buy is 10, PE is below 10, ROE is above 15 and DY above 3). If a stock fulfills the criteria it will get chosen to backtest the performance. I am using monthly frequency here (which mean the frequency you change your position to buy new stocks as the criteria might change over time for a stock) but there are plenty of choices for frequency for you to experiment as well.
Let’s see how the performance goes. We gt a compounded annual growth rate (Cagr) of 36%. That is not bad at all! It is also shown that the strategy outperforms the KLSE index (the red line) as well. The program assumes that you start with capital of RM1,000.
Here’s some explanation of the output.
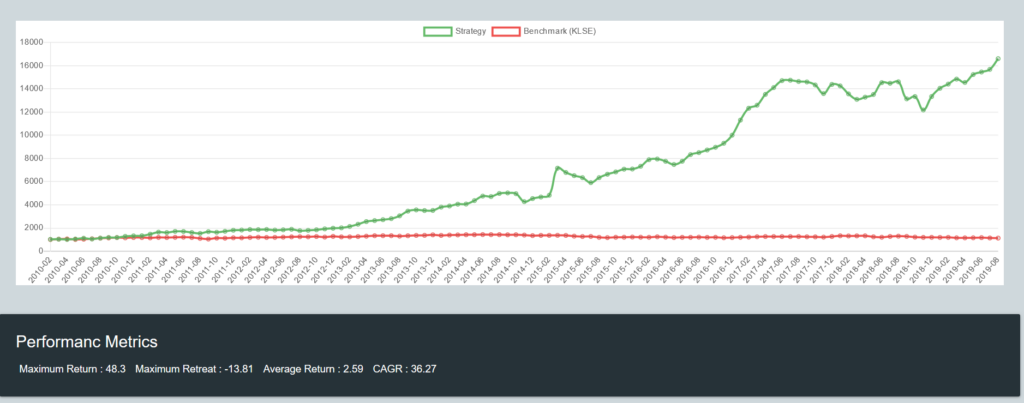
The green line is the capital growth of your stock picking strategy. The red line corresponds to performance of KLSE index. We take the performance of KLSE index as benchmark so we know have we got a better return than simply buying KLSE ETF and hold.
The maximum return the strategy achieved is 48.3%, with worst return of -13.81%. On average, each trade generates 2.59% of return. The compounded annual growth rate of the strategy is 36%. The strategy also outperforms KLSE index greatly, with RM1,000 invested, you will get RM16,000 in return whereas KLSE only provide RM1,131 in return.
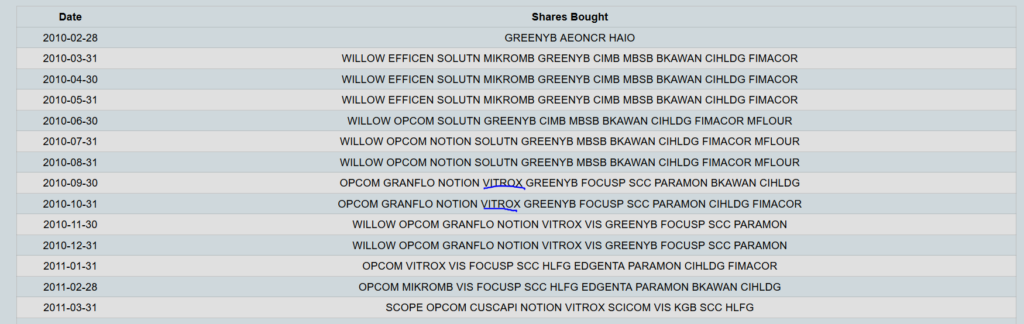
This table is the stocks that fulfilled the stock picking criteria you defined. It gives you a rough idea what stocks will be picked based on your strategy. Why is there only 3 stocks bought in some months? It is because during the month no other stocks fulfill the stock picking criteria so only a little stocks are bought. (**Can you notice that this strategy captures super long bullish stock like Vitrox?)
Afterthoughts