Intro
I assume that you already knew the anatomy of a candlestick so I will skip the explanation part.
There are dozens of candlestick pattern out there, be it bullish or bearish ones, what we wanted to know is that can we used them reliably in our investing and trading activities.
Methodology – Skip this part if you’re not into tech
It is possible to manually code a program to identify every pattern but that will be a lot of workload. Fortunately, there is a python library called TA-Lib, which included the identification of candlestick pattern given price data. In this study, 10 years worth of daily price data (Open, Low, High, Close) was scraped online and saved into a .csv file.
I have written a piece of code that will iterate over the price data to find candlestick pattern. Comment below if you wanted a copy of the code and data.
Loading the Patterns
We need pandas module for data processing, and talib for it’s fast and ready-made candle recognition capability.After that, we need to make a list of every pattern that we wanted to backtest.
import pandas as pd
import talib
import os
pd.set_option('expand_frame_repr', False)

pattern_name = ['CDL2CROWS','CDL3BLACKCROWS','CDL3INSIDE','CDL3LINESTRIKE','CDL3OUTSIDE',
                'CDL3STARSINSOUTH','CDL3WHITESOLDIERS','CDLABANDONEDBABY','CDLADVANCEBLOCK',
                'CDLBELTHOLD','CDLBREAKAWAY','CDLCLOSINGMARUBOZU','CDLCONCEALBABYSWALL',
                'CDLCOUNTERATTACK','CDLDARKCLOUDCOVER','CDLDOJI','CDLDOJISTAR',
                'CDLDRAGONFLYDOJI','CDLENGULFING','CDLEVENINGDOJISTAR','CDLEVENINGSTAR',
                'CDLGAPSIDESIDEWHITE','CDLGRAVESTONEDOJI','CDLHAMMER','CDLHANGINGMAN',
                'CDLHARAMI','CDLHARAMICROSS','CDLHIGHWAVE','CDLHIKKAKE','CDLHIKKAKEMOD',
                'CDLHOMINGPIGEON','CDLIDENTICAL3CROWS','CDLINNECK','CDLINVERTEDHAMMER','CDLKICKING',
                'CDLKICKING','CDLKICKINGBYLENGTH','CDLLADDERBOTTOM','CDLLONGLEGGEDDOJI',
                'CDLLONGLINE','CDLMARUBOZU','CDLMATCHINGLOW','CDLMATHOLD','CDLMORNINGDOJISTAR',
                'CDLMORNINGSTAR','CDLONNECK','CDLPIERCING','CDLRICKSHAWMAN','CDLRISEFALL3METHODS'
                'CDLSEPARATINGLINES','CDLSHOOTINGSTAR','CDLSHORTLINE','CDLSPINNINGTOP',
                'CDLSTALLEDPATTERN','CDLSTICKSANDWICH','CDLTAKURI','CDLTASUKIGAP','CDLTHRUSTING',
                'CDLTRISTAR','CDLUNIQUE3RIVER','CDLUPSIDEGAP2CROWS','CDLXSIDEGAP3METHODS']
Reading Stock Market Data
Candlestick analysis are mostly used by short term traders, so the days I wanted to backtest are in short term as well.
days = [1,5,10,30]

path = os.getcwd()
print('current working directory:',path)
stock_code_list = []
for root, dirs, files in os.walk(path):
    if files:
        for f in files:
            if '.csv' in f:
                stock_code_list.append(f.split('.csv')[0])
Let’s Analyse !
output = pd.DataFrame()
final_output = pd.DataFrame(columns=['Pattern', 'Win Rate (1 Day)', 'Win Rate (5 Days)','Win Rate (10 Days)',
                                     'Win Rate (30 Days)'])

for pattern in pattern_name:
    for code in stock_code_list:
        df = pd.read_csv(code + '.csv', parse_dates=[1])

        for i in days:
            df['Gains after ' + str(i) + ' days'] = df['Close'].shift(-i)/df['Close'] - 1

        df[pattern] = getattr(talib, pattern)(df['Open'].astype(float).values, df['High'].astype(float).values,
                                                        df['Low'].astype(float).values,df['Close'].astype(float).values)

        pattern_df = df[df[pattern] != 0]
        output = output.append(pattern_df)

    try:
        bullish_output = output[output[pattern]>0]
        OneDayWinRate = len(bullish_output.loc[bullish_output['Gains after 1 days'] > 0]) /\
                        len(bullish_output['Gains after 1 days'])
        FiveDaysWinRate = len(bullish_output.loc[bullish_output['Gains after 5 days'] > 0]) /\
                          len(bullish_output['Gains after 5 days'])
        TenDaysWinRate = len(bullish_output.loc[bullish_output['Gains after 10 days'] > 0]) /\
                         len(bullish_output['Gains after 10 days'])
        ThirtyDaysWinRate = len(bullish_output.loc[bullish_output['Gains after 30 days'] > 0]) /\
                            len(bullish_output['Gains after 30 days'])
        final_output = final_output.append({'Pattern': 'Bullish ' + pattern,
                                            'Win Rate (1 Day)': OneDayWinRate,
                                            'Win Rate (5 Days)': FiveDaysWinRate,
                                            'Win Rate (10 Days)': TenDaysWinRate,
                                            'Win Rate (30 Days)': ThirtyDaysWinRate}, ignore_index=True)
    except Exception as e:
        print("No bullish pattern")

    try:
        bearish_output = output[output[pattern] < 0]
        OneDayWinRate = len(bearish_output.loc[bearish_output['Gains after 1 days'] > 0]) / \
                        len(bearish_output['Gains after 1 days'])
        FiveDaysWinRate = len(bearish_output.loc[bearish_output['Gains after 5 days'] > 0]) / \
                          len(bearish_output['Gains after 5 days'])
        TenDaysWinRate = len(bearish_output.loc[bearish_output['Gains after 10 days'] > 0]) / \
                         len(bearish_output['Gains after 10 days'])
        ThirtyDaysWinRate = len(bearish_output.loc[bearish_output['Gains after 30 days'] > 0]) / \
                            len(bearish_output['Gains after 30 days'])
        final_output = final_output.append({'Pattern': 'Bearish ' + pattern,
                                            'Win Rate (1 Day)': OneDayWinRate,
                                            'Win Rate (5 Days)': FiveDaysWinRate,
                                            'Win Rate (10 Days)': TenDaysWinRate,
                                            'Win Rate (30 Days)': ThirtyDaysWinRate}, ignore_index=True)
    except Exception as e:
        print("No bearish pattern")

    print('Done analysis on ' + pattern)

print(final_output)
final_output.to_csv('candlestick_analysis.csv',index=False)
Results
The performance of each candlestick is measured by how likely it will go up in (1,5,10,30) days. A win rate of 0.7 means that in 7 out of 10 times the price will go up after the pattern appeared.
Here’s the entire backtesting results!
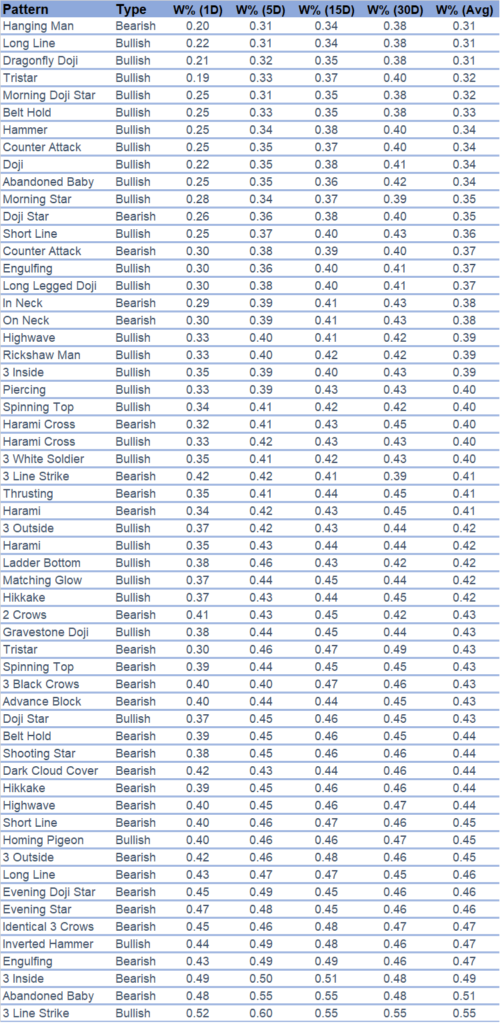
Very surprisingly some bullish pattern has very low win rate, my thinking is that when a pattern is too widely known and used, the edge of the pattern diminishes as everyone knows the information making it useless.
Besides, the findings also showed very little pattern with winrate more than 50% (I thought I will found my golden formula here :disappointed: ). However there is some relatively high winrate patterns with winrate over 0.45. Perhaps with enough risk management techniques you might be able to construct a consistently profitable strategy.
Some Thoughts
Of course there are something this study misses, for example, some candlestick pattern are only effective while they are on top of the trend etc. Nevertheless this brings me a general view of the effectiveness of candlestick pattern.
I am wondering combined with other technical indicators will the winrate be higher? Also, the low winrate doesn’t mean that it is worthless. A 20% winrate indicats there it is 80% likely that the price will drop tomorrow. How about using this as a indicator for shorting of stocks? Well, I leave this to you guys to figure out. Let me know what you think in the comments.
This study is purely for discovery and fun. Please be responsible of your own money and trade at your own risk.