The mysterious “Window Dressing”
I know
This is a crazy idea, why would there be difference in returns among months?
But stay with me,
after around 5 years in the market, I have heard a lot of news and rumours,
about which season/month is more bullish.
One of the example is the infamous phenomena we called “Window dressing”,
where fund managers would buy in to inflate the price of the assets,
so that the funds under their management look good at the start of the year.
Is this true?
Well, as an engineer, I will not settle at news and rumours,
Let’s find out
Reading data
First we are going to need monthly historical data of KLSE index.
I already have one, I got it from Yahoo Finance for free
import pandas as pd

KLSE_data = pd.read_csv('MKLSE.csv',parse_dates=['Datetime'])

KLSE_data.head(5)| Datetime | Open | High | Low | Close | Adj Close | Volume | |
|---|---|---|---|---|---|---|---|
| 0 | 2010-10-31 | 1468.45 | 1505.66 | 1462.27 | 1505.66 | 1,505.66 | 123,952,000,118,754,000,000,000,000,000,000,00… |
| 1 | 2010-11-30 | 1510.69 | 1531.99 | 1474.02 | 1485.23 | 1,485.23 | 89,809,800,125,250,500,000,000,000,000,000,000… |
| 2 | 2010-12-31 | 1482.69 | 1529.95 | 1477.57 | 1518.91 | 1,518.91 | 153,042,000,150,431,000,000,000,000,000,000,00… |
| 3 | 2011-01-31 | 1524.53 | 1576.95 | 1505.36 | 1519.94 | 1,519.94 | 142,815,000,204,667,000,000,000,000,000,000,00… |
| 4 | 2011-02-28 | 1524.74 | 1544.35 | 1474.38 | 1491.25 | 1,491.25 | 122,139,600,155,642,000,000,000,000,000,000,00… |
The data is just simple dataset with open, low, high, close and volume.
Monthly Fluctuations
Let’s look at the fluctuations first, first we have to calculate the fluctuations or change every month
KLSE_data['Change'] = (KLSE_data['Close'] - KLSE_data['Open'])/KLSE_data['Open']
KLSE_data.plot.line(x = 'Datetime', y = 'Change')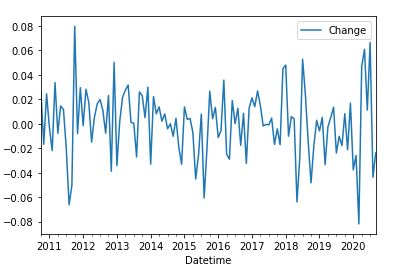
The fluctuations are just around 0,
that doesn’t look very interesting, let’s try analyzing this dataset another way
Monthly Average Returns
Let’s get the average change of every month and have a look
# We need calendar module to parse into months in words
import calendar

KLSE_data['month'] = KLSE_data['Datetime'].dt.month
temp_data = KLSE_data.groupby(['month'])

month = pd.DataFrame(columns = ['Month','Change'])

for index,m in temp_data:
    temp_month = m['month'].iloc[0]
    mm = calendar.month_abbr[temp_month]
    temp_change = m['Change'].mean()
    month = month.append({'Month': temp_month,
                          'Change': temp_change}, ignore_index=True)

month.plot(x = 'Month', y = 'Change', kind = 'bar')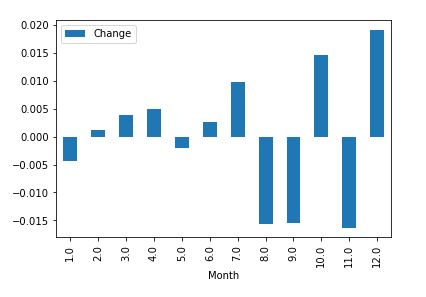
If we look at the average returns for every month,
December look significantly higher than the rest
A More Careful Look at Monthly Returns
Just to be careful, bar chart doesn’t tell you the whole story,
the data might be skewed, a boxplot will be a better way to interpret this data
(What is a Boxplot)?
import matplotlib.pyplot as plt

KLSE_data.boxplot(column = ['Change'], by = 'month',
                 showfliers = True, grid = False)
plt.axhline(y = 0, color = 'green', linestyle = 'dotted')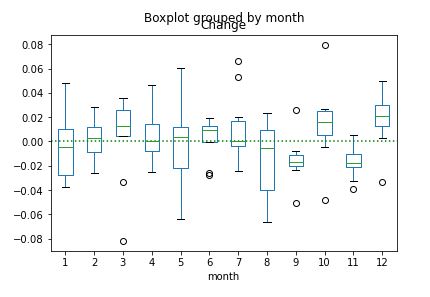
Now we can look at this dataset at a bigger picture,
December is indeed a profitable month, with a few outliers..
Other than December, there are other promising months too..
March, June, October, December
Can We Trade on This?
This got me thinking,
what if I long KLSE every historically profitable months?
Let’s set up a trading strategy, long KLSE every july, october and december
(top 3 most profitable months according to our analysis)
KLSE_data['signal'] = KLSE_data['month'].apply(lambda x: 1 if (x==7 or x == 10 or x == 12) else 0)
KLSE_data['return'] = KLSE_data['Change']*KLSE_data['signal']

KLSE_data['Capital'] = 0
InitialCapital = KLSE_data['Close'].loc[0]

for i in range(0,len(KLSE_data)):
    if i == 0:
        KLSE_data.loc[i, 'Capital'] = InitialCapital
    else:
        KLSE_data.loc[i, 'Capital'] = ((KLSE_data['return'].loc[i] + 1.0)
                                   * KLSE_data['Capital'].loc[i - 1])

KLSE_data.plot.line(x='Datetime',y=['Capital','Close'])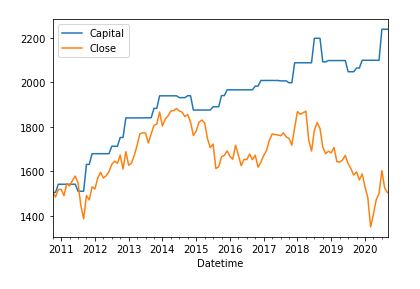
The performance looks great, or is it??
- First, what happens in the past don’t guarantee future performance,
- Second, in statistics terms, this dataset is too small and this is likely the result of overfitting.
and this feels like giving teaching people how to get rich by telling them your lottery number
Key Takeaways
From past 10 years worth of data,
December is indeed a profitable, bullish month
Does that mean we should buy in every December?
I will to leave the answering and decision to you.
History doesn’t repeat itself, but it does rhyme
Mark Twain
This isn’t any trading advice and the studies and analysis done were for educational and sharing purposes only