In the times of extreme panic, just stand there and do nothing
At the time of writing,
Russia is invading Ukraine, and this sparked a lot of economic sanctions, rising energy prices, business disruptions, market is speculating FED to raise rates, which the market do not like.
Every major market indices are dipping,
portfolio turned red, even cryptocurrencies followed the trend as well
(which makes me think that crypto may no longer work as a hedge against financial instruments?)
The vibe/atmosphere is eerily similar to that of March 2020.
When news coverage all reports as if the world is going to end, the market’s going to collapse. But like Howard Marks said, “most of the time, the end of the world doesn’t happen”.
What happened after March 2020, the market broke its previous high, vaccines were developed, even anti-viral medicines are made. If we sold during that period, we would have missed the bulls.
This had not happened only once, but many times in history.
The market behaves and runs in cycles of boom and bust, euphoria and depression, bulls and bears. Market cycles are very well explained in two of my favourite books, “Mastering the Market Cycle” by Howard Marks and “The Changing World Order, Why Nations Succeed and Fail” by Ray Dalio.
In times of panic, it is easy to get influenced and make decisions that are not optimal.
In fact, it is these times that make it possible to outperform others in the market.
You will certainly not outperform the crowd, if you are doing what the crowd is doing. Just like you won’t get that promotion if nothing differentiates you from your co-workers!
By definition, to do significantly better than others, you must be willing to do things that are uncomfortable, against our human nature of crowd following.
With that being said, let’s go to my favourite part, look at some data
Methodology
I extracted monthly returns data of SP500, KLSE, SGX and the Shanghai Composite Index
picked the best 10 months and 10 worst months in terms of returns in the past 10 years and plotted them chronologically
import pandas as pd
import matplotlib.pyplot as plt
plt.style.use('seaborn')
plt.rc('ytick', labelsize=15)
plt.rc('xtick', labelsize=15)

def process(name):
    filename = name + '_monthly.csv'
    df = pd.read_csv(filename)
    df = df.dropna(axis = 1)
    df['Change'] = df['Change']*100

    df = df.sort_values(by = 'Change')
    df_worst = df.head(10)

    df = df.sort_values(by = 'Change', ascending = False)
    df_best = df.head(10)

    df_concat = pd.concat([df_best, df_worst])
    df_concat['Date'] = pd.to_datetime(df_concat['Date'])
    df_concat['Date'] = df_concat['Date'].dt.to_period('M')
    df_concat = df_concat.sort_values(by = 'Date')
    df_concat = df_concat[['Date', 'Change']]

    return df_concat

fig, axs = plt.subplots(2, 2, figsize=(15,15))

df_KLSE = process('KLSE')
df_KLSE.plot.barh(x = 'Date', y = 'Change', ax = axs[0,0],
                  color= (df_KLSE['Change'] > 0).map({True: 'g', False: 'r'}))

df_SGX = process('SGX')
df_SGX.plot.barh(x = 'Date', y = 'Change', ax = axs[0,1],
                  color= (df_SGX['Change'] > 0).map({True: 'g', False: 'r'}))

df_Shanghai = process('Shanghai')
df_Shanghai.plot.barh(x = 'Date', y = 'Change', ax = axs[1,0],
                  color= (df_Shanghai['Change'] > 0).map({True: 'g', False: 'r'}))

df_SP500 = process('SP500')
df_SP500.plot.barh(x = 'Date', y = 'Change', ax = axs[1,1],
                  color= (df_SP500['Change'] > 0).map({True: 'g', False: 'r'}))

axs[0,0].set_title('Best and Worst 10 Months Return by Time (KLSE)', fontsize = 15)
axs[0,1].set_title('Best and Worst 10 Months Return by Time (SGX)', fontsize = 15)
axs[1,0].set_title('Best and Worst 10 Months Return by Time (Shanghai)', fontsize = 15)
axs[1,1].set_title('Best and Worst 10 Months Return by Time (SP500)', fontsize = 15)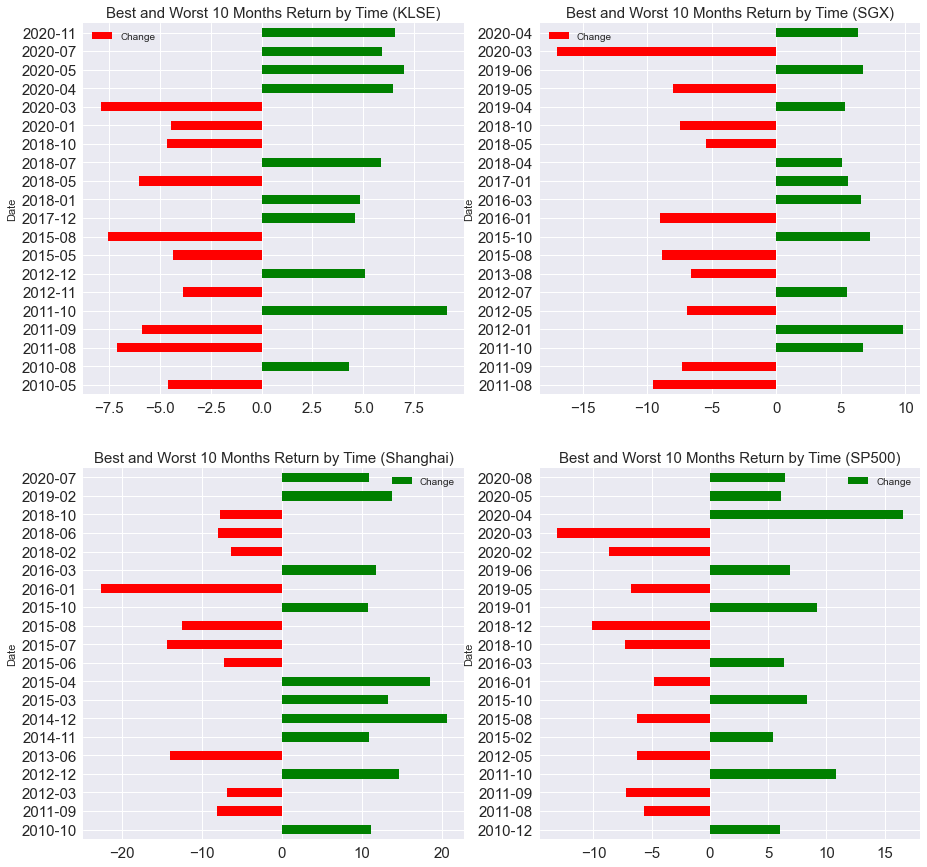
Thoughts
The results reminded me of a sine wave, peaks followed troughs and troughs followed peaks. Doesn’t it look like a cycle?
After a very bad month, it seems that the best months will follow. However, in some cases, it might take around 6 months for that to happen. In other words, just because the market experienced a bad month, doesn’t mean that it will go up tomorrow.
TLDR
- Market have this cyclic behaviour, boom and bust always repeat themselves
- Just because the market had a very bad month, doesn’t mean that it will go up tomorrow. It can take up to 6 months for a significant recovery to happen, until then, be prepared and save up for your silver bullets
- This pattern exists in different markets, at least the 4 that we have studied here
This isn’t any trading advice and the studies and analysis done were for educational and sharing purposes only