The war and Covid continued to April 2022, but the world haven’t ended, and markets have rebounded quite significantly, I vividly remember that Alibaba soared 30% in a day in HKSE. This happened over and over again, fear to greed, bear to bull.
But anyway, following my previous post link, can we profit from this information?
Strategy Rules
- Save up RM 1000 every month in form of cash.
- If last month’s return is worse than any of the previous 10 worst months (2 years ago) return, buy in with all the cash saved up.
- If last month’s return is better than any of the previous 10 best months (2 years ago) return, sell 50% of the position owned.
- Trading fees are negated.
Show Me The Code
import pandas as pd
import matplotlib.pyplot as plt
plt.style.use('seaborn')

df = pd.read_csv('data/MSP500.csv', parse_dates=['Date'])
df = df.dropna(axis = 1)

df_2years = df.head(24)
df_worst = df_2years[df_2years['Change'] < 0]
df_worst = df_worst.head(10).sort_values(by = 'Change')

df_best = df_2years[df_2years['Change'] > 0]
df_best = df_best.head(10).sort_values(by = 'Change', ascending = False)

monthly_investment = 1000
df['Cash'] = monthly_investment
df['Shares'] = 0
df['DCA'] = 0
df['Buy'] = None
df['Sell'] = None

df = df[df['Date'] > '01-01-2013']
plt.subplot(2,1,1)
plt.plot(df['Date'], df['Close'])

for i in range(0,len(df)):

    df['Shares'].iloc[i] = (df['Change'].iloc[i] + 1) * df['Shares'].iloc[i-1]
    df['DCA'].iloc[i] = (df['Change'].iloc[i] + 1) * (df['DCA'].iloc[i-1] + monthly_investment)

    df['Cash'].iloc[i] = df['Cash'].iloc[i-1] + monthly_investment
    df['Strategy'] = df['Shares'] + df['Cash']

    if (df['Change'].iloc[i]) < (df_worst['Change'].iloc[-1]) :
        df_worst = df_worst.append(df.iloc[i])
        df_worst = df_worst.sort_values(by = 'Change')
        df_worst = df_worst[:-1]

        df['Shares'].iloc[i] += df['Cash'].iloc[i]
        df['Cash'].iloc[i] = 0
        df['Buy'].iloc[i] = 1
        plt.scatter(x = df['Date'].iloc[i], y = df['Close'].iloc[i], color = 'g', marker = '^', s = 100)

    if (df['Change'].iloc[i]) > (df_best['Change'].iloc[-1]) :
        df_best = df_best.append(df.iloc[i])
        df_best = df_best.sort_values(by = 'Change', ascending = False)
        df_best = df_best[:-1]

        df['Cash'].iloc[i] += 0.5*(df['Shares'].iloc[i]*(1 + df['Change'].iloc[i]))
        df['Shares'].iloc[i] = 0.5*(df['Shares'].iloc[i]*(1 + df['Change'].iloc[i]))
        df['Sell'].iloc[i] = 1
        plt.scatter(x = df['Date'].iloc[i], y = df['Close'].iloc[i], color = 'r', marker = 'v', s = 100)

plt.subplot(2,1,2)
plt.plot(df['Date'], df['Strategy'], label = 'Strategy')
plt.plot(df['Date'], df['DCA'], label = 'DCA')

plt.legend()

plt.show()
Backtest Results
As usual, I backtest strategy on 4 markets, SP500, Shanghai Index, Singaporean Stock Index and Malaysian Stock Index. The coloured arrows meant,
Red Downward Arrow = SellGreen Upward Arrow = Buy
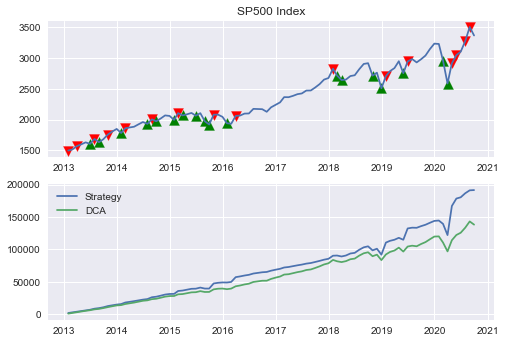
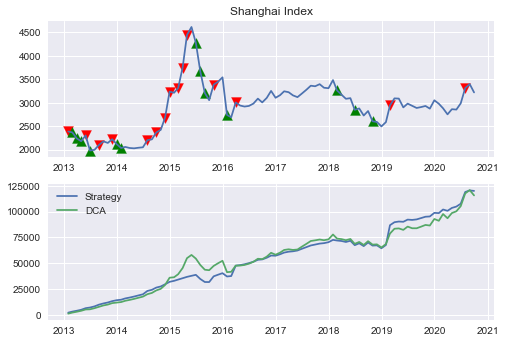
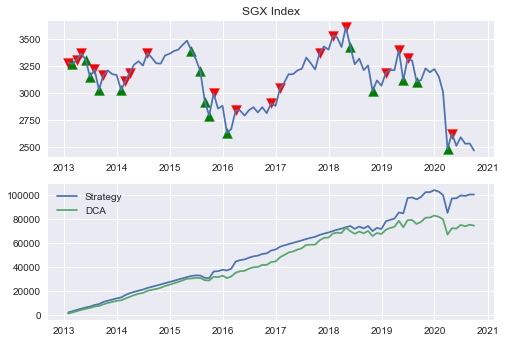
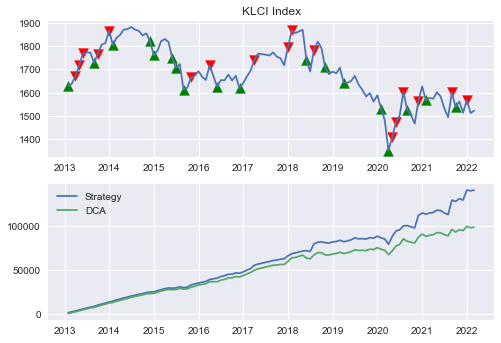
The figures are plot such that the buy and sell points were plotted as coloured arrows, and the plot underneath it is the growth of capital using this strategy and Dollar Cost Averaging strategy.
To my surprise, the strategy outperformed DCA in every market backtested. This is because DCA strategy is difficult to outperform, hence it is promoted by a lot of people.
TLDR
- Buy Low Sell High using 10 best months return and 10 worst months return did outperformed Dollar Cost Averaging strategy.
- The strategy managed to bought at majority of lows happened, and sold at majority of highs, though it will sell even when the market is making multiple highs every consecutive months.
- This can be a good market timing strategy, but prone to short bursts of bull run like observed in Shanghai Index.